Statistics - Overview
Zoho Discussions allows you to measure your portal activities and the user participation trends using statistics. With this feature, you can track a wide variety of metrics to understand how your users are participating in your community with the user-friendly graphs and diagrams thus helping you to improve the user interactions.
The statistics tab contains different sections namely Dashboard, Discussions, Questions, Ideas and Problems. Dashboard provides a summary of your overall portal activities while the other sections display reports specific to the selected topic type.

Following are the list of statistics available in Zoho Discussions:
Portal Usage
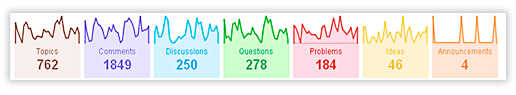
The portal usage summary allows you to take a look at the overall activities carried by you and your users in the community. It shows the number of topics, comments posted in your community. In addition, you can see the numbers of posts specific to each topic types.
You can see the portal usage for a particular week, month or for a particular time intervals. If you have several forums in your portal, you can use the Forum Filter and view your portal usage for a particular forum.
|  |
Topic Response Trend
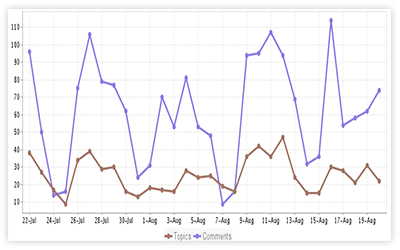
The topic response summary provides a graphical view of the topics and responses posted on your portal. From this graph, you can understand how many topics and comments are posted for a selected time period.
You can select different time intervals to understand how the topic-response trend varies. If you have several forums in your portal, you can use the Forum Filter and view your portal usage for a selected forum.
You can further drill down and analyze this report for a specific topic type by navigating to the corresponding section. For Example: If you wish to see the topic response trend for a particular topic type namely Problems, you can navigate to the problems tab and view how many problems and solutions are posted for a selected time period.
|  |
Responsiveness
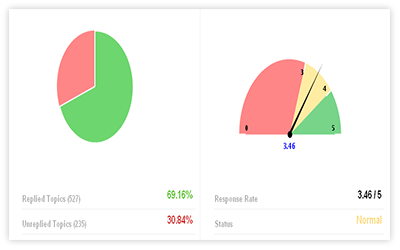
The responsiveness report shows the percentage of topics that received responses from the participants and the percentage of topics yet to be replied for a selected time period. If you have several forums in your portal, you can use the Forum Filter and view the responsiveness summary for a particular forum.
This report can be limited to a specific topic type. For Example: If you wish to see how many questions are answered, you can navigate to the Questions tab and view the responsiveness statistics for Questions.
In addition, you can view the rate in which a specific question is answered using the Response Rate Statistics.
|  |
Topic Types Trend
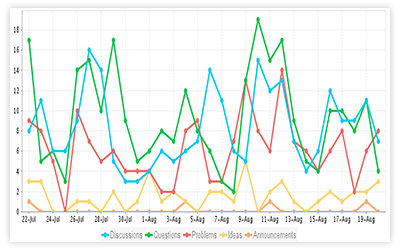
The topic type trend provides a graphical view of the overall topic types used for a selected time period. With this report, you can understand which topic types are used most often by your users.
You can also select different time periods (weekly, monthly or for a selected date range) to understand the how the topic-type trend varies. . If you have several forums in your portal, you can also use the Forum Filter and view your topic types trend for a particular forum.
|  |
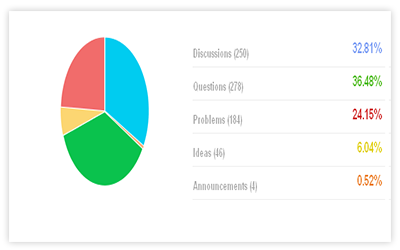
Topic Types Overview
The Topic Types Overview allows you to take a look at the number of discussions, questions, ideas, announcements and problems posted in your community.
You can also see the topic types summary for a particular week, month or for a particular time intervals. If you have several forums in your portal, you can use the Forum Filter and view your portal usage for a specific forum.
|  |
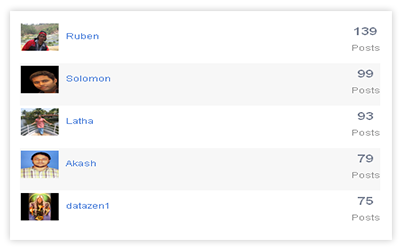
Top Contributors
The top contributors report shows the list of most active users on your community. i.e., you can see those who have posted a maximum no. of posts including topics and responses. In addition, this report displays the images of the top contributors along with the total number of posts they have published.
You can see the top contributors report for a selected time period and for a particular forum. For example: If you wish to see the list of users who have posted a maximum no. of posts on a particular forum, you can use forum filter and select the forum to view the top contributors report.
|  |
Unique User Participation Trend
The Unique User Participation trend shows how many new visitors are participated in your portal over the course of a specified time period. You can also select different time intervals to understand how the unique user participation trend varies. If you have several forums in your portal, you can use the Forum Filter and view the user participation trend for for a selected forum.
You can further drill down and analyze this report for a particular topic type by navigating to the specific topic type tab. | 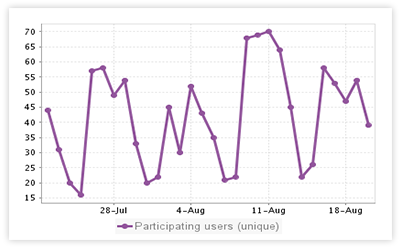 |
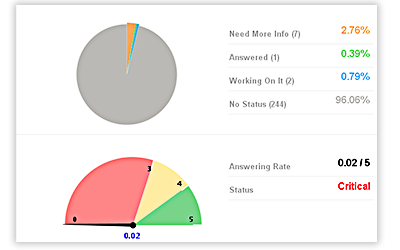
Topic Status View - By Status
The Topic Status report shows the number and percentage of Questions and Answers that are updated with proper status. You can see this report for a particular week, month or for a particular time intervals.
In addition, you can view the rate in which a specific question/problem is answered using the Answering Rate Statistics
|  |
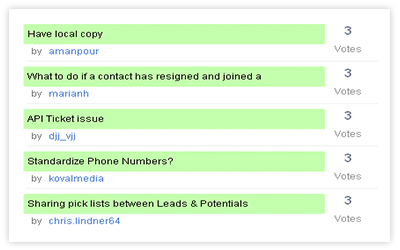
Most Useful Discussions
The Most useful discussions statistics shows the list of discussions that have a maximum no. of votes. With this report, you can identify which topics are most useful to your users.
You can see the list of most useful discussions for a particular week, month or for a particular time intervals. If you have several forums in your portal, you can use the Forum Filter and view the most useful discussions report for a selected forum.
This report can also be viewed from the corresponding topic type section - Discussions
|  |
Most Asked Questions
The Most useful discussions statistics shows the list of questions that are asked more frequently on your community. This specific report is calculated based on the number of votes each questions have received. You can see the list of most asked questions for a particular week, month or for a particular time intervals. If you have several forums in your portal, you can use the Forum Filter and view the most asked questions report for a selected forum. This report can also be viewed from the corresponding topic type section - Questions.
|  |
Most Reported Problems
The Most Reports problems statistics shows the list of common problems that are reported by most of your users. This specific report is calculated based on the number of votes each problems have received. You can see the list of most reported problems for a particular week, month or for a particular time intervals. If you have several forums in your portal, you can use the Forum Filter and view the most reported problems report for a selected forum. This report can also be viewed from the corresponding topic type section - Problems. | 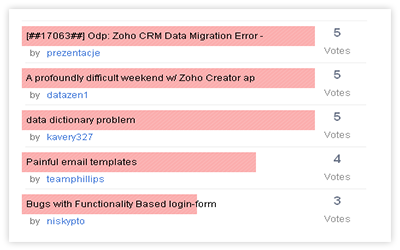 |
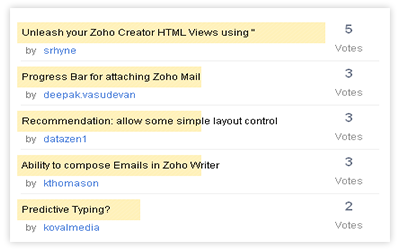
Most Liked Ideas
The Most Liked Ideas statistics shows the list of ideas that are most popular. This specific report is calculated based on the number of votes each ideas have received.
You can see the list of most liked ideas for a particular week, month or for a particular time intervals. If you have several forums in your portal, you can use the Forum Filter and view the most liked ideas report for a selected forum.
This report can also be viewed from the corresponding topic type section - Ideas.
|  |
| Note: To see the list of metrics associated to each topic type, please click on the corresponding topic type tab. |
How-Tos
To view statistics for a selected time period: - Go to your portal
- Click on Statistics tab and select Dashboard.
- Choose Last 30 days from the drop down menu to view reports for the last month
- Choose Last 7 days to view reports for the past week.
- Choose Date Interval to view reports for a specific time interval
To view statistics for a particular forum:
- Go to your portal
- Click on Statistics tab and select Dashboard.
- Choose a forum from the Filter By drop down list.
You can view the list of statistics for the selected forum.
 Uploading ....